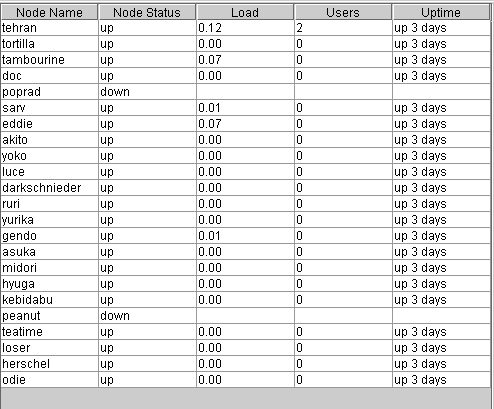
The cluster information panel contains information about the cluster in general, and the nodes that
comprise the cluster. The right half of the screen contains a table listing the nodes of the cluster,
and various information about each node. This information consists of the node's status, ie. whether it
is up or down, the node's one minute load, which is an indicator of how busy it is, the number of
users logged onto each node, and the uptime of the node, which is the time from when it was last
rebooted.
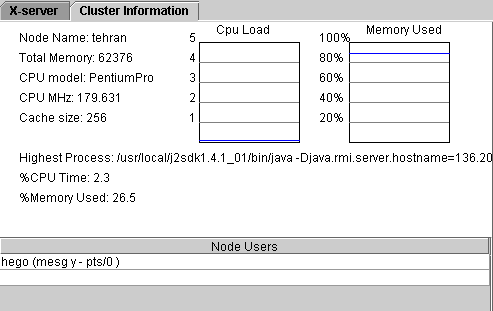
The left hand panel is composed of three parts. The first is information about the currently selected
node. You can change the currently selected node by clicking on the appropriate row of the table
in the right hand panel. This information comprises the node name, the total amount of memory it has,
the CPU model name, speed in megahertz and cache size. There is also two moving graphs which illustrate
the load of the CPU over time, as well as the amount of memory that is used, as a proportion of the
total memory. Finally, the highest process on the currently selected node is displayed, as well as
the percentage of CPU time and percentage of total memory that process is using. The middle panel shows the names of users that are logged onto the root node and whether they have messages
turned on or off.
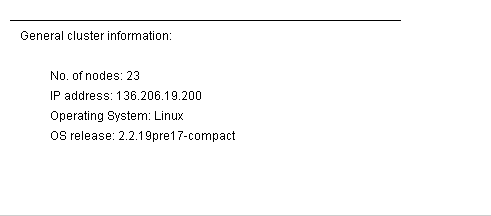
The bottom panel on the left hand side shows general information about the cluster. This is comprised of
the number of nodes of the cluster, the ip address of the head node, the operating system being used on
the cluster, and the operating system version being used, ie. the kernel release number.